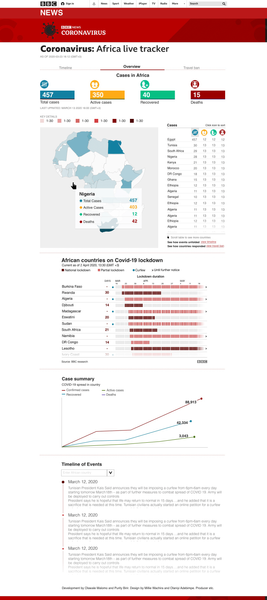
BBC News Covid-19 in Africa tracker
Project Brief
Develop a platform that will present COVID 19 numbers and statistics in Africa.
At the time, reporting of COVID 19 cases in Africa was not up-to-date on most dashboards. The 12 BBC language service websites needed a platform where they could relay verified statistics collected by their large pool of reporters across Africa.
User Needs
The audiences needed a reliable, up-to-date platform where they could keep tabs of COVID 19 cases on the continent.
My Role
I took on the lead role of designing a platform that relayed information in an easy to read format while avoiding the cognitive overload that is frequently experienced in dashboard design. I used visual design techniques to create a web interface that was clean, following the grid system to present the different information visualizations in a structured way.
Design Process
We conducted a competitive analysis to establish the design and technical gaps in the existing COVID 19 dashboards and data websites. I also researched dashboard design best practices and suitable data visualization options to present the data.
I identified cdc.gov, bing.com, ourworldindata.org among others, as websites that could be used for benchmarking on best practice in information architecture, content structuring and data visualization options.
Findings
Existing dashboard designs were heavy with text and graphics, subjecting audiences to information overload. Some data visualizations also required more cognitive effort to understand, seemingly targeting an expert audience. Most websites were not responsive on mobile view and therefore not suitable for African audiences who mostly access the internet via mobile devices.
Design Solution
The resulting dashboard presented Africa-specific Covid-19 data in an airy, visually pleasing page that made use of white space and iconography to capture the audience's attention and increase recall of categories by using semiotic cues.
Design deliverables included wireframes done in Sketch, a clickable prototype in Marvel, a handoff link on Marvel and UI assets. The webpage went through two rounds of iteration after the initial launch.


